2019 Water Projection: Missouri River Charts you need to see
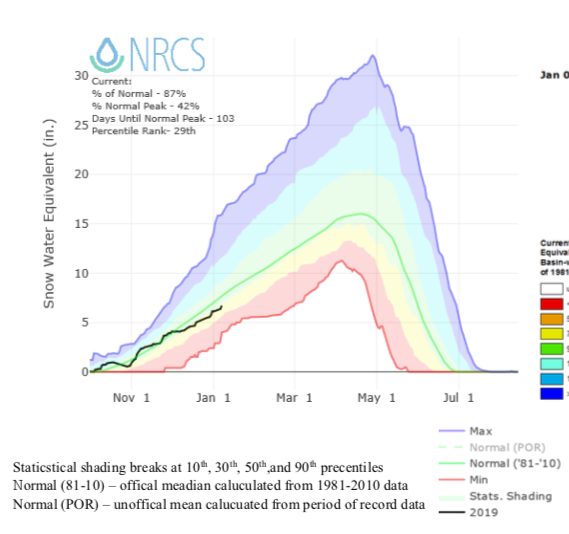
The top image is telling.
103 days of potential water ahead of us. Mid April is the peak of the snow on the ground. The water that counts for the summer. Ground water content, moisture levels, that kind of stuff. Forecasting summer water April 20th is the day in the water managers timeline.
If you look at the above image the green line is the 30 year average. Looks like we are near 90%. Better than some years, nt as good as others.
High(er) than average water comes once every three years. Average once every three. You get it. Lower than…
So where does that leave us? Nothing surprises us here in Craig. Other than last year. That surprised everyone. TH length of time the water was super high, was a long three months. That kind of event does not happen but once a generation, or longer. That was a 50 year water event.
The weather guessers predict more of the same. Warmer and drier than average in our region.
What does that mean? More dry fly fishing. Our Headhunting brains lean that direction. Lower than average water? I may need a new pair of Wading flip flops this summer.
4 Comments.
more like 40th %ile, not 90th….but who knows if more moisture will show up later this winter!
That is the question.
I hate to be selfish, but after the last two years of high water in the end of June it would be nice to have 5K or 6K. I predict the trout in their “Fat Elvis” mode after last years flushing.
Reservoirs full, trout fat and 5K end of June. It is my dream.
I think it may come true!?!? We like dry fly water in June too.